
Is the fight against inflation in North America nearly over?
19 July 2023
Central Bank Flexibility Sparks Market Volatility
2 August 2023RISK INSIGHT • 26 JULY 2023
Have we seen the peak in UK rates?

Marc Cogliatti, Head of Capital Markets EMEA
And what does this mean for sterling in the months ahead?
Our bullish sterling bias since the start of the year has looked very good so far, but could this be the turning point? Is it time to switch to a more bearish outlook? Maybe, but maybe not (or at least, not yet!).
In the UK, sterling has been through a period of stellar performance as stubborn inflation has fuelled fears that the Bank of England will be forced to continue hiking rates for longer and to higher levels than previously expected. In fact, just two weeks ago, the OIS curve had UK rates peaking at 6.37% in March 2024.
However, just as last week’s report was published, the Office for National Statistics published its UK inflation readings for June which showed headline CPI falling to 7.9% from 8.7% in May and notably below the consensus forecast for a reading of 8.2%. Unsurprisingly, the markets began to price out the likelihood of aggressive hikes and consequently, rates are now seen peaking at 5.8% in February 2024. Sterling fell 1.35% against the Greenback and 1.07% against the euro on the news.
Chart 1: GBPUSD 2022/23
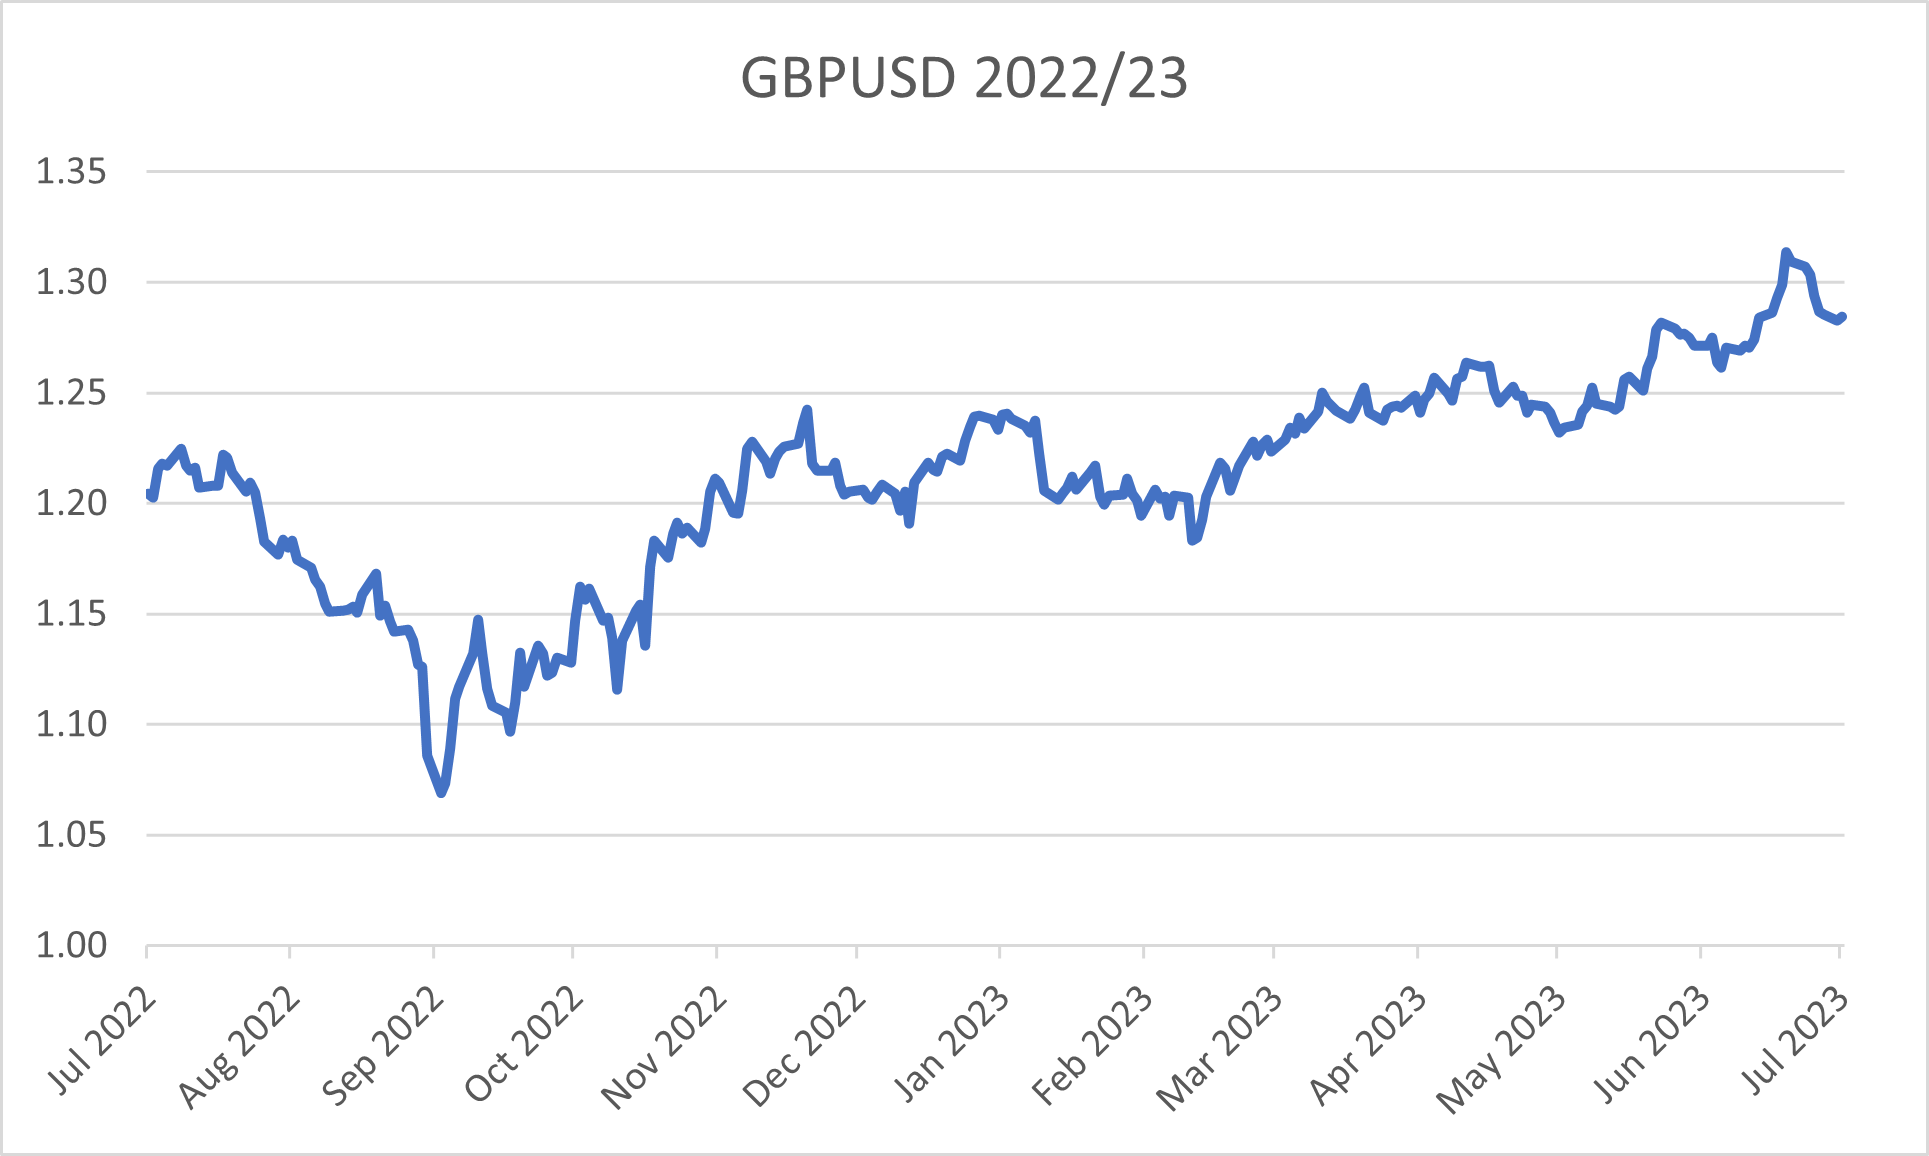
Source: Bloomberg
A closer look at the UK inflation data shows that the fall was aided by a larger than expected decline in goods price inflation (8.5% in June from 9.7% in May and well below its peak of 14.8% from October last year). However, inflation stemming from the service sector continues to rise (currently 7.2% vs the Bank of England’s forecast of 6.7%).
With core inflation still sticky at 6.9%, we see justification for the BoE to maintain its cautious / hawkish tone and continue with further tightening in the months ahead, at least until there is clear sign of price rises slowing in other key parts of the economy. Meanwhile, given sterling’s recent momentum, coupled with the fact that it still looks cheap on a purchasing power parity basis, there should be scope for the pound to advance further in the months ahead and for now, this remains our overall bias.
That said, there are a couple of indicators that are starting to make us feel a little nervous:
- Positioning – The latest data from the CFTC, shows the market net long 63,729 contracts, its highest level since August 2008. While this obviously suggests plenty of positive sentiment being sterling, positioning tends to relatively cyclical and such extremes rarely persist for a prolonged period.
- Risk Reversals – since 2007, the cost of protecting against a move lower in sterling has consistently been higher than protecting against a move higher. Although this remains the case, we’re edging back towards neutral territory which by recent standards, has proved to be a turning point for the pound.
- Consensus Forecast – given the pound’s recent out performance, there has been a notable shift amongst analysts towards a more bullish outlook for the pound. Again, this should be positive signal for sterling, but we typically see this as a contrarian indicator (and history has proved us right).
Last week, my colleague Ryan Brandham wrote a piece about inflationary pressures showing signs of easing in North America. In recent weeks, market perception seems to have been that as inflationary pressures ease, particularly in the US, the Fed will be able to take its foot off the tightening pedal and slow the pace of rate hikes, before potentially easing policy mid-way through 2024. In turn, this has weighed on the dollar as the prospect of lower rates makes the dollar less attractive for investors to hold.
Chart 2: GBP Positioning
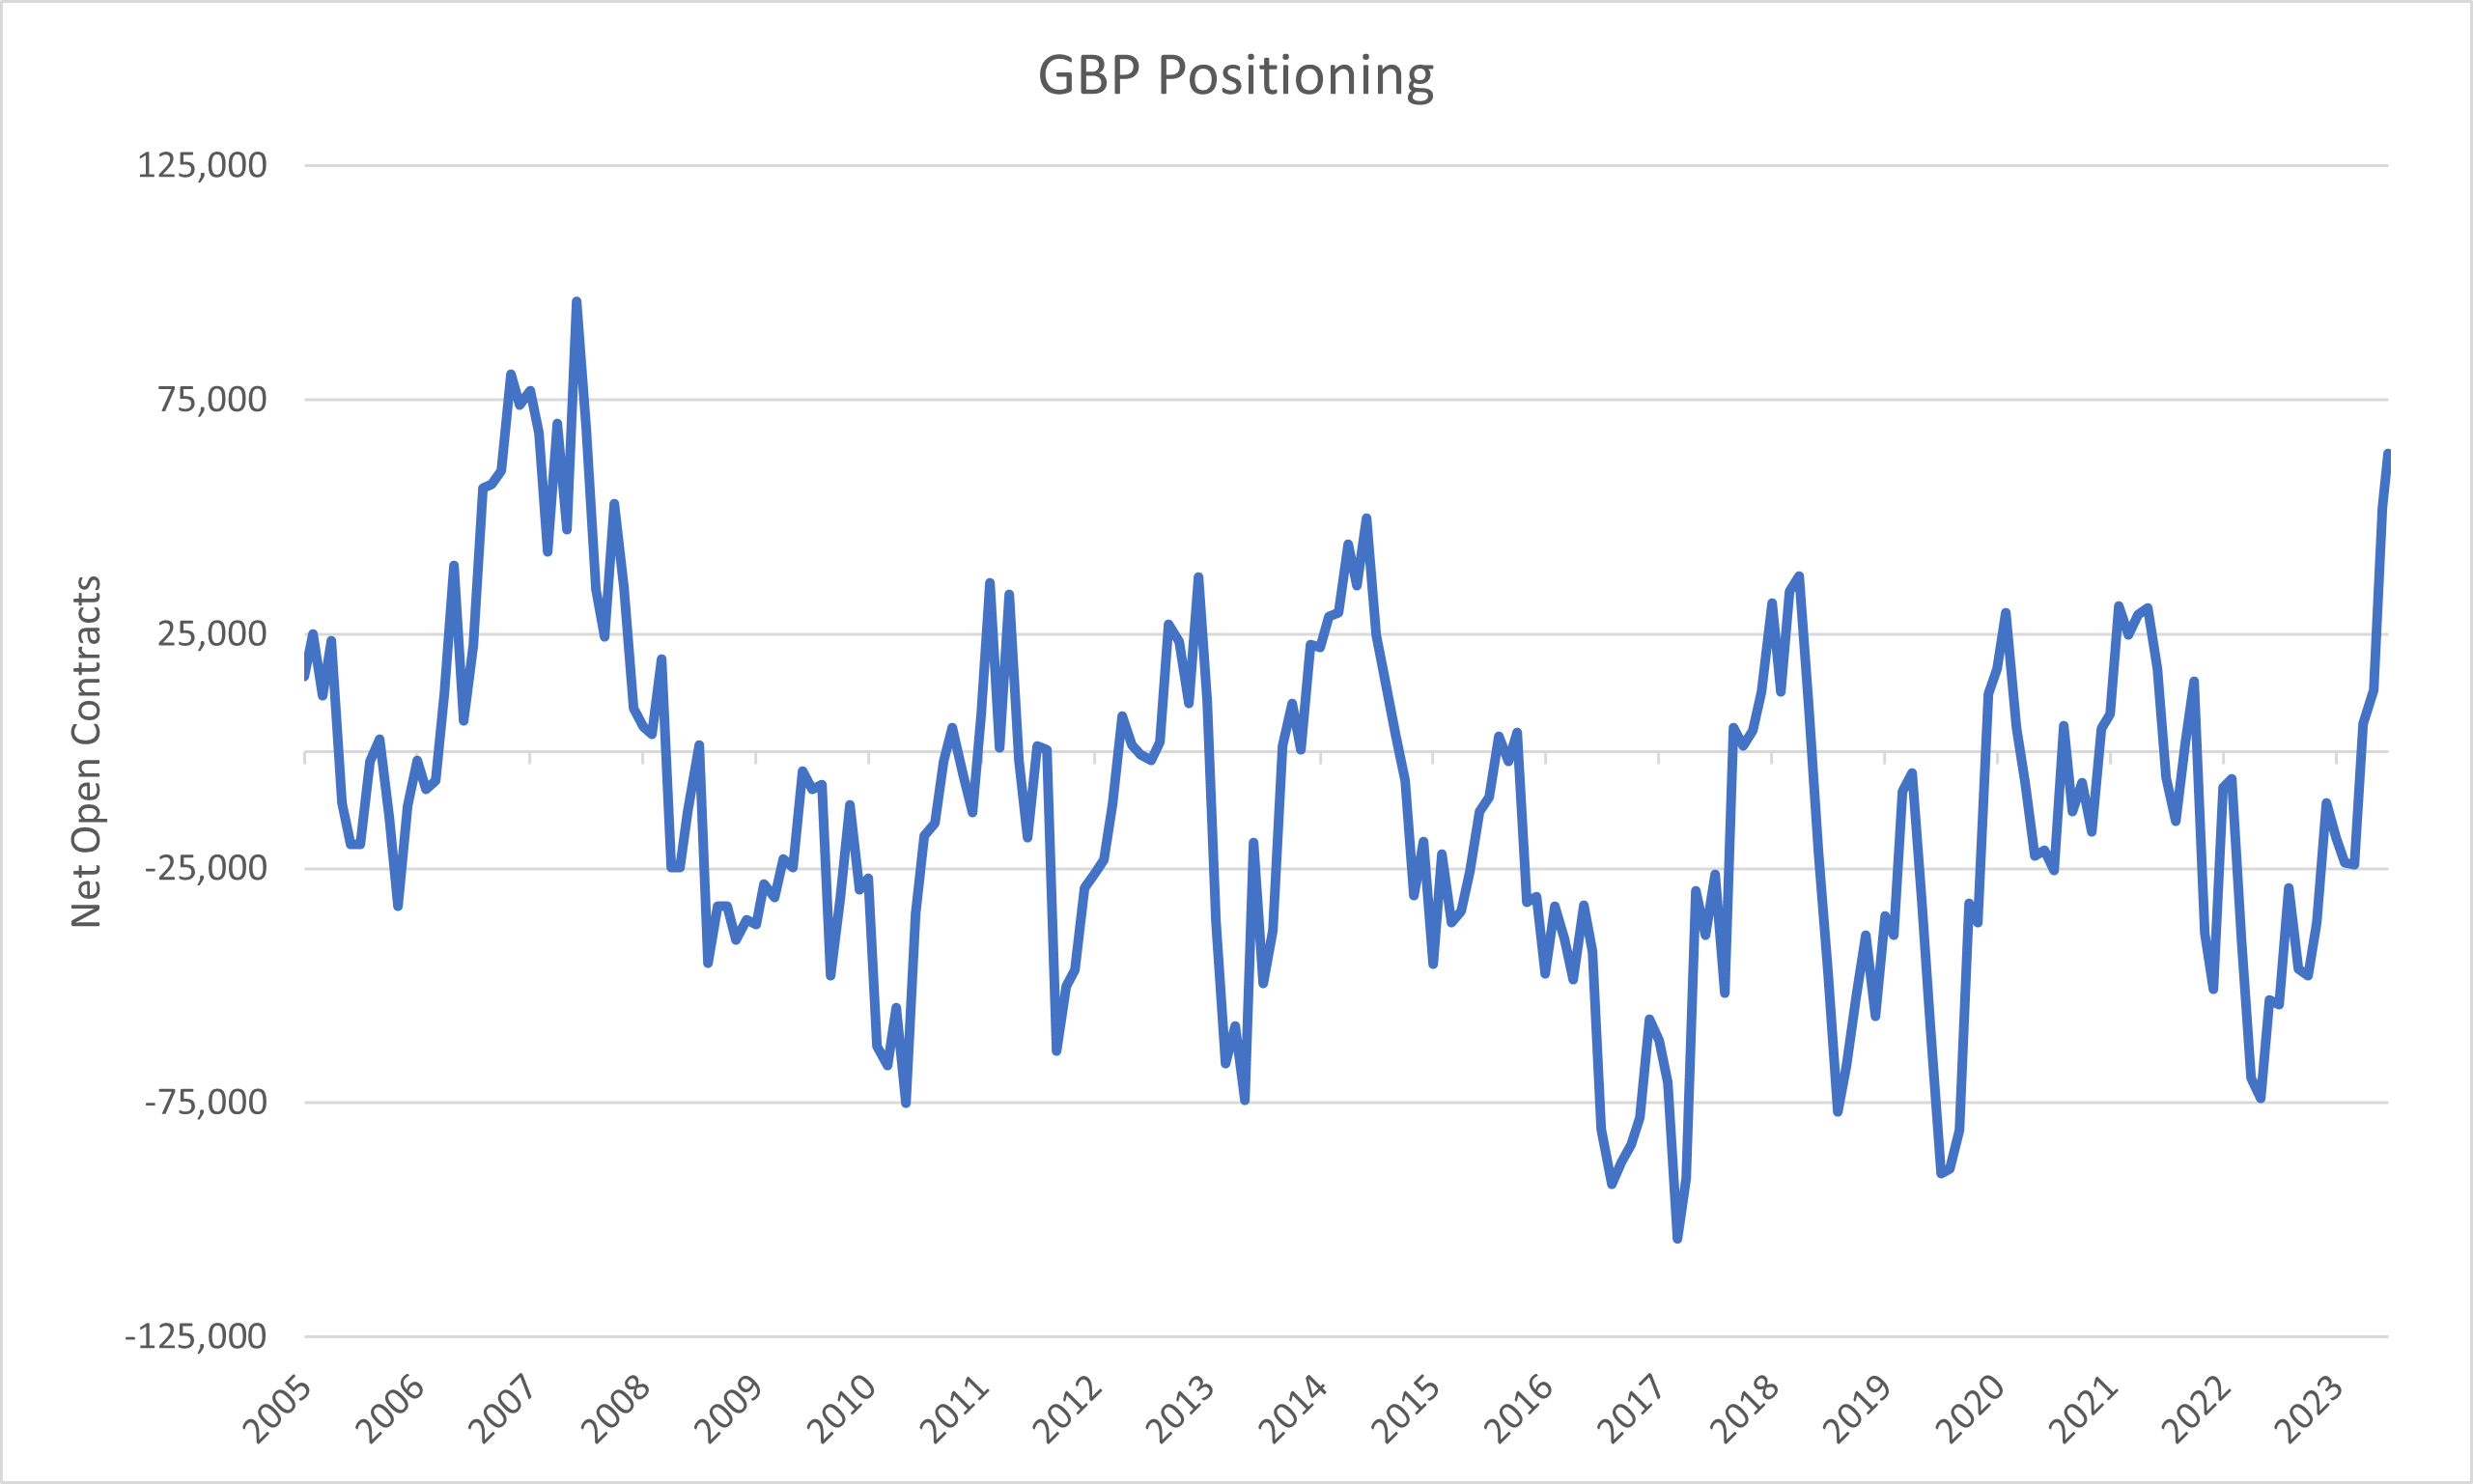
Source: CFTC/ Bloomberg
Be the first to know
Subscribe to our newsletter to receive exclusive Validus Insights and industry updates.